Introduction
Thunderstorms present a significant hazard to people and infrastructure in their path. The hazard is not only from the lightning itself but also the associated risk from flash flooding, strong gusts, intense hail and tornadoes. Even areas such as the UK, where the threat of lightning is perceived to be low, still experience injuries, deaths and damage to buildings each year (Elsom and Webb, 2014). Knowledge of the time and location of lightning can be used for early warning by national weather services, usually in combination with radar and satellite imagery (Darden et al., 2010).
The potentially catastrophic consequences of a direct lightning strike at a site where people, sensitive equipment or explosive material are exposed to the atmosphere make provision for its early warning attractive, despite the generally very low probability of occurrence.
The aim of this work is to assess the effectiveness of meteorological observations made at the site of interest in warning of imminent nearby lightning. Given the broad variety of meteorological observations available, those which are known to be regularly associated with thunderstorm activity have been selected. The three in situ parameters are heavy rain (RA+), rainfall electric charge (CR), and strong atmospheric electric field variability (dE). In addition, lightning detection was made at the site for flashes up to 83km away, which was the maximum reporting range of the site’s lightning detector. Nearby lightning was used to validate the warnings, and distant lightning (DL) was used as an additional predictive parameter. For this study, the distinction between nearby and distant lightning was defined at 18.5km (10 nautical miles), which is the definition of the upper range for ‘thunderstorm in the vicinity’ (VCTS) used in US METAR (weather observation) reports (FAA, 2011).
These four parameters can be measured automatically during both day and night at sites typical of an urban environment with a limited view of the horizon. Lightning warning using single-site observations is especially useful where access to real-time data from remote observations is not possible or cannot be guaranteed.
Site and instrumentation
The four parameters (RA+, CR, dE and DL) were measured at an urban site in the coastal town of Portishead, near Bristol, in southwest England (51°48’N, 2°77’W). The instruments were installed on the edge of a small first storey roof terrace, approximately 4m from the building wall and 3m from a row of small trees. The instrument used to measure CR, dE and DL was a BTD-300 thunderstorm detector, developed and manufactured by Senseca UK. This instrument detects these parameters in real time for the purpose of issuing local thunderstorm alerts, updating warnings every 2s. The BTD-300 consists of three radially symmetric antennas with a shared vertical axis. The upper antenna is a sphere of radius 0.15m, with two horizontal toroidal antennas positioned directly below (Figure 1). The BTD-300 differs from conventional thunderstorm detectors, since it uses the relatively slow variation of cloud electrostatic field change during lightning (1–45Hz) to detect and range lightning flashes (Bennett, 2013). The BTD-300 detects and ranges both cloud-to-ground and intra-cloud flashes up to 83km away, but does not distinguish between them. Due to the relatively recent development of this instrument (commercial launch in 2013) there has been no independent quantitative assessment of its performance. However, assessments made by the manufacturer using lightning location network data found a lightning detection probability in excess of 95% and false alarm rate below 2%. Lightning location uncertainty is specified by the manufacturer as ±5km for <20km range, otherwise ±10km.
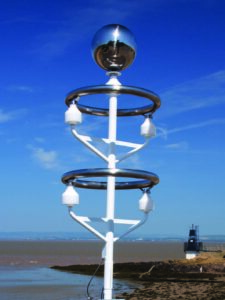
Figure 1. The BTD-300 thunderstorm detector
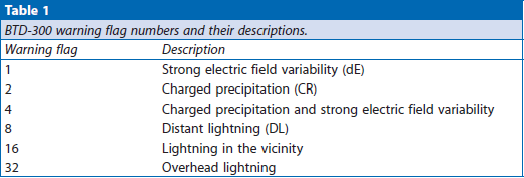
The type of event which triggered the BTD-300 to produce a warning is identified by the ‘warning flag’. This is a number in the main data message which can be used to see whether the warning was associated with the detection of lightning, charged rain, strong electric field variability or a combination of different events. The warning flags and their description are provided in Table 1. The only non-electrical parameter used in this investigation is heavy rain. This was measured using a Senseca UK VPF-730 visibility and present weather sensor located ~2m from the BTD-300. This instrument classifies hydrometeor type (rain, snow etc.) and intensity. The sensor determines the 1min mean precipitation rate, which was found to be generally within 10% of a tipping bucket rain gauge.
Whilst the official definition of heavy rain (RA+) differs between countries, the World Meteorological Organisation (WMO) defines heavy rain as being >10mmh−1 (WMO, 2008). This definition is also used in the UK by the Civil Aviation Authority (CAA) for heavy rain associated with cumuliform cloud, but reduces to >4mmh−1 for stratiform cloud (CAA, 2014). Given that no automatic precipitation measurement is currently able to identify the type of cloud from which the precipitation is falling, many present weather sensors in the UK will always define RA+ as >4mmh−1. The definitions of heavy rain are abbreviated here by a subscript after RA+ denoting the minimum rainfall rate used, for example 4 and 10mmh−1 will be RA+4 and RA+10 respectively. It should be noted that the 1min rainfall intensity averaging period used for this investigation differs from the official WMO intensity classification averaging period of 3min (WMO, 2008), so the VPF-730 data will be expected to have a somewhat higher variability. This is more favourable for capturing the peak intensity of a rainfall event and may be more typical of that recognised by a human observer.
For private observers interested in thunderstorm observation, it is worth noting that relatively low-cost radio-based lightning detectors which are designed to detect predominately cloud-to-ground lightning within several tens of kilometres are available commercially. Alternatively, near real-time lightning location maps are available free online, for example on the website of the Met Office. Rain rate can be measured using relatively low-cost commercial automatic weather stations, which usually incorporate a tipping-bucket rain gauge. It is, however, difficult to measure charged precipitation or strong electric field variability without specialist equipment.
Charged rainfall and rapid electric field variability
The first continuous measurements of the electrical charge on rain were conducted over 100 years ago by Simpson (1909) in Shimla, northern India, during deep convection associated with the monsoon seasons of 1907/1908. He found that no clear relationship could be made between charge magnitude and rainfall intensity. This suggests that additional information on the storm may be gathered from rainfall charge compared with its intensity alone. The reason for this charge was considered by Simpson to be the result of droplet break-up in strong updrafts. This explanation was contested by the Nobel laureate C. T. R. Wilson, who instead proposed that the charge on convective rainfall resulted from the selective capture of ions by the raindrops as they neared the ground (Wilson, 1929). Wilson’s proposed ion capture mechanism for rain drop charging was recognised by Simpson when he discovered that the charge magnitude on raindrops was proportional to that of the near-surface electric field, although of opposite polarity, termed the ‘mirror image effect’ (Simpson, 1949).
The BTD-300 detects the charge on each hydrometeor (e.g. raindrop or snowflake) from the transient increase in electric field immediately before the hydrometeor impacts on the antenna. This temporary increase in charge on one antenna induces a signal of opposite polarity on the other antennas. This effect is used to distinguish the signals of charged precipitation from lightning, since the latter generates the same polarity signal on all three antennas (Bennett, 2013). The charge magnitude sufficient to activate a warning of charged rain (CR) by the BTD-300 corresponds to approximately 50pC per raindrop by default, but can be varied by the user. Default thresholds were used throughout this investigation.
Convective precipitation is capable of producing strong and rapidly varying electric fields near the surface due to charge carried to ground on hydrometeors, in addition to the ions released near the surface by point (corona) discharge from the strong electric field below a thunderstorm (Chalmers, 1961). This increased electric field variability has been recognised as a characteristic of nearby deep convection and it is considerably faster than that produced by the overhead passage of cloud (Bennett and Harrison, 2007; 2008). The 1–45Hz variability in electric field (dE) is measured by the BTD-300, with a warning being issued if the magnitude exceeds a threshold and is not associated with lightning or charged precipitation. The default threshold used in this investigation is of order 10Vm−1s−1.
Data analysis and results
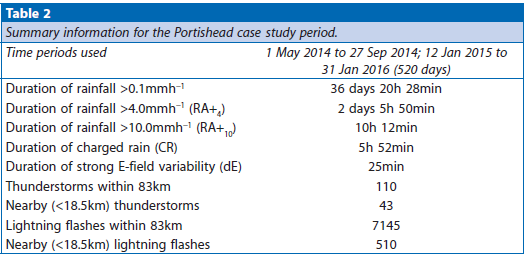
A summary of precipitation durations and the thunderstorm and lightning datasets used is provided in Table 2. The dataset began on 1 May 2014 and ended on 31 January 2016. The total of 520 days of continuous sampling reflects a 3-month period where there was no BTD-300 installed at Portishead, as well as short periods of downtime due to maintenance of the sensor or data servers. A storm was defined as at least one lightning flash separated by at least 30min. This definition differs from the traditional ‘10 minute rule’ of the Observers Handbook (Meteorological Office, 1982), where a storm is considered to have ceased 10min after the last thunder was heard at the site. This study considers the presence of lightning significantly beyond thunder audible range, so a storm tends to be monitored over a greater portion of its lifetime. A relatively long time period for storm cessation was therefore used to ensure single storms with low flash rates were not double-counted in the analysis. For comparison, using the 10min rule increased the number of nearby and <83km storms by approximately 40%, although the number of storms reported as overhead only increased from 11 to 12 (9%). All single flash occurrences were checked for coincidence with deep convective cloud to ensure they were likely to be genuine. A list of all days where nearby lightning was detected is provided in Table A1 of the appendix.
The first stage of the investigation was to determine the typical lead times of CR, dE, DL and RA+4 to nearby lightning, to assist the selection of an appropriate early warning time limit. Distant lightning (DL) was present within 60min for 96% of nearby flashes and within 30min for 93% of nearby flashes. The lead times of the in situ measurements (CR, dE and RA+4) up to 60min are shown in Figure 2. Like distant lightning, it can be seen that the majority of lead times for all three parameters were also within 30min. Given that a 30min warning also offers a compromise between providing adequate warning and excessive persistence of the warning after the last signs of electrical activity are detected, this time period was used to define whether a parameter provided an early warning of a nearby lightning event. A safety margin of 30min since the last sound of thunder is also recommended by the US National Weather Service.
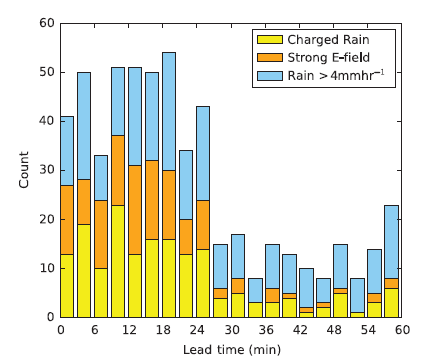
Figure 2. Lead times of charged rain (CR), strong E-field variability (dE) and rainfall >4mmh−1 (RA+4) to nearby flashes. Data presented as a stacked histogram at 3min intervals, with the height of the bar indicating the number of incidences recorded.
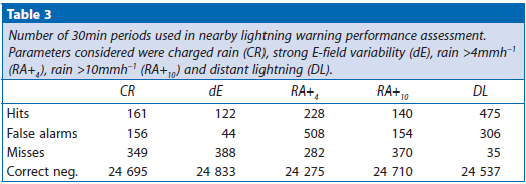
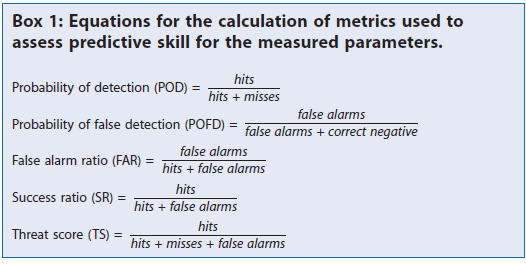
The number of times when a nearby lightning flash was or was not preceded by each parameter (‘hits’ and ‘misses’ respectively) is shown in Table 3, along with the number of warnings without nearby lightning within 30min (false alarms). So that the false alarms can be put into context, the number of correct negatives is also provided, which is where a parameter did not produce a warning and no nearby lightning occurred within 30min. These data are used to quantify the performance of each parameter as a method of warning for nearby lightning, using the metrics commonly used to assess forecasting skill described in Box 1. These metrics were calculated for each parameter and are shown in Table 4. All values will lie between 0 and 1, with 1 being a perfect score for POD, SR and TS (no misses or false alarms), and 0 being a perfect score for POFD and FAR (no false alarms).
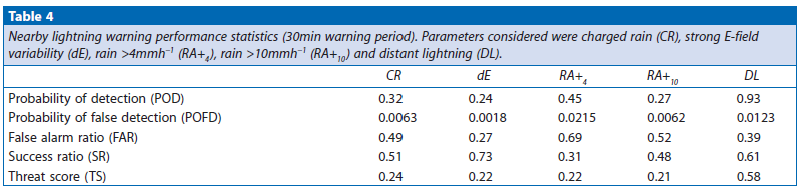
The performance metrics in Table 4 identify distant lightning (DL) as the parameter most likely to occur within 30min before nearby lightning, with a POD of 0.93. The other parameters had significantly lower POD at less than 0.5, meaning that they were not present within 30min in over half of the 510 nearby flashes. All parameters had low POFD (i.e. false alarm rates), at between 0.18 and 2.15%. RA+4 had the highest POFD and FAR, with 69% of warnings not associated with nearby lightning. This is consistent with the CAA’s intensity-based definition of heavy rain as being too low to represent that from a cumulonimbus, with nimbostratus being the more likely source. If 10mmh−1 is used to define heavy rainfall most likely to be from a cumulonimbus (with its associated lightning risk) the FAR is reduced from 0.69 to 0.52, bringing it significantly closer to the 0.39 associated with distant lightning. The FAR associated with distant lightning arises when a distant storm does not move towards the site, or ceases lightning activity before moving nearby. For example, the unexpectedly severe night-time storm of 13/14 June 2014 which produced frequent lightning over central southern England (Grahame et al., 2015) began approximately 60km northeast of the Portishead site, where it activated a distant lightning alert. Despite producing 327 flashes within 83km, no nearby lightning ensued, with the closest flash being 30km away. It is therefore worth considering that for this investigation only lightning proximity was investigated, so the distant lightning FAR would have likely been reduced if only flashes upwind of the thunderstorm steering wind were used to warn. Despite its low POD, the potential utility of strong electric field variability (dE) in warning of nearby lightning was demonstrated by having the lowest POFD and FAR – even lower than those for distant lightning. In essence, although the dE warning was not issued very often, when it was it had the highest likeliness that a nearby flash would occur within 30min, with 73% of all warnings being successful.
The threat score offers a single value from which to evaluate the parameters with each other, accounting for hits, misses and false alarms. Distant lightning has the highest score, with a TS of 0.58. Charged rain is second at 0.24, with the remaining parameters close behind.
Rainfall rate versus charge for lightning warning
It can be seen from Tables 3 and 4 that charged rain (CR) offers a comparable false alarm rate to heavy convective rain (RA+10), although CR has a slightly higher success ratio due to having 21 more hits. The percentage of time that rainfall was sufficiently charged to activate a charged rain alert is plotted against rain rate threshold in Figure 3. This figure confirms the expectation that, on average, more intense rainfall is more likely to be significantly charged. Overall, 23% of RA+4 was significantly charged, compared with 50% of RA+10 and 82% of RA+25. However, given that 31% of charged rain alerts occurred at moderate intensities below 4mmh−1, this association does not always hold during individual rainfall events, as first observed by Simpson (1909). From Table 4 it would appear that charge is better overall at predicting nearby lightning than intensity. The relative merit of charge over intensity is emphasised when considering its ability to predict the first nearby flash of the storm. Of the 43 nearby thunderstorms, the first nearby flash was preceded by charged rain within 30min on 9 occasions, compared with 6 for RA+10. These findings support the hypothesis that rainfall charge is more skilful than rain rate for warning of nearby lightning.
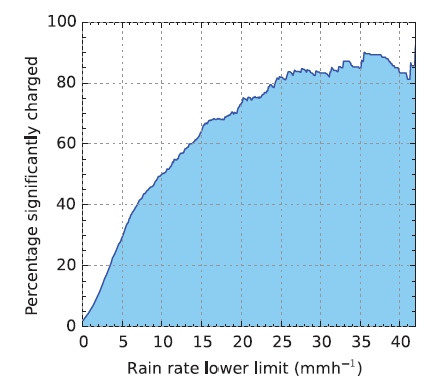
Figure 3. Percentage of rainfall sufficiently charged to be defined as charged rain (CR), in relation to the lower limit of rainfall rate, used to classify heavy rain. Threshold for charge magnitude corresponded to approximately 50pC per hydrometeor.
In terms of success ratio, a very heavy rain rate of 25mmh−1 (RA+25) would need to be used to match the 0.73 provided by strong electric field variability (dE). The skill added by atmospheric electricity measurements is further demonstrated by this comparison, since there was only one instance of RA+25 preceding the first nearby lightning flash, compared to 5 warnings using dE.
Warning of the first nearby flash
The most important nearby flash to warn about is the first. Of the 43 nearby thunderstorms, 24 (56%) had at least one distant flash up to 30min before the first nearby flash. An example of an approaching distant thunderstorm heralded by its lightning is shown in Figure 4. For this event, distant lightning was clearly the best parameter to provide adequate warning of the storm’s arrival.
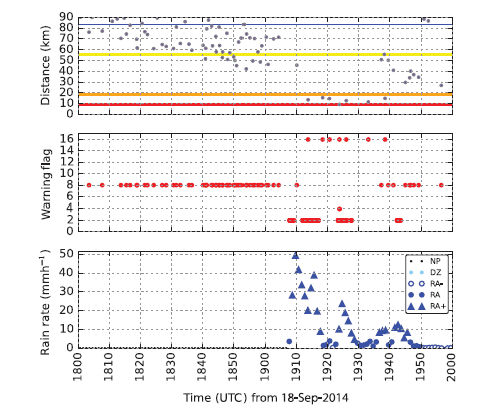
Figure 4. An example of distant lightning providing ample early warning of nearby lightning on 18 September 2014. The top plot shows distance to the lightning flashes with time. Horizontal lines on this plot represent US METAR lightning reporting thresholds: red for overhead, orange for vicinity, and yellow for distant. The blue line identifies the maximum warning range of the BTD-300. The middle plot shows the time of warnings produced by the BTD-300. The ‘warning flag’ number indicates the type of event which triggered them. In this instance, warnings were first produced by distant lightning (flag 8), followed by charged rain (flag 2) just before the nearby lightning (flag 16). The lower plot shows rain rate with time. Heavy, moderate, and light rainfall is indicated by filled blue triangles, filled circles, and open circles, respectively.
For the 19 nearby thunderstorms where the first nearby flash was not preceded by distant lightning (44% of all nearby thunderstorms), 12 were preceded by RA+4, 9 by CR, 6 by RA+10 and 5 by dE. Examples of events when non-lightning warning parameters provided the only early warning of the first nearby flash are shown in Figures 5 and 6. The lead times of CR, dE and RA+4 to the first nearby flash of a thunderstorm are shown in Figure 7. Unlike distant lightning from an already active thunderstorm, which can be detected over an hour before the storm arrives, most of the lead times are between 1min and 6min, but some exceeded 20min. Although short, such lead times would be sufficient to take immediate precautions, such as seeking shelter prior to the development of an overhead thunderstorm and would not be available at all if only lightning was used to warn.
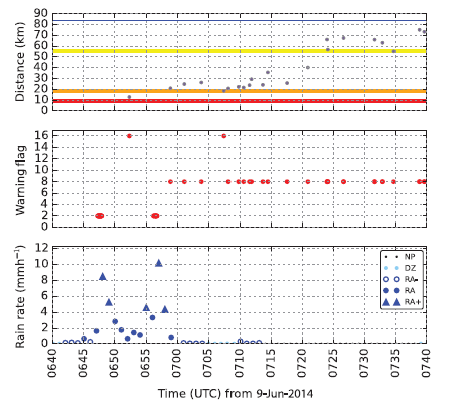
Figure 5. Overhead thunderstorm development on 9 June 2014, with the first flash of the storm occurring nearby. The top plot shows distance to the lightning flashes with time. Horizontal lines on this plot represent US METAR lightning reporting thresholds: red for overhead, orange for vicinity, and yellow for distant. The blue line identifies the maximum warning range of the BTD-300. The middle plot shows the time of warnings produced by the BTD-300. The ‘warning flag’ number indicates the type of event which triggered them. In this instance, warnings were first produced by charged rain (flag 2), approximately 4min before the first flash of the storm, which was nearby (flag 16). Distant lightning (flag 8) was the cause for continued warnings as the storm moved away. The lower plot shows rain rate with time. Heavy, moderate, and slight rainfall is indicated by filled blue triangles, filled circles, and open circles, respectively. Drizzle is indicated by small filled light blue circles
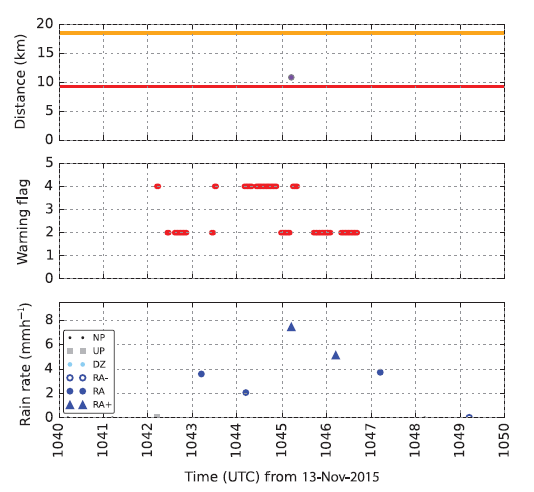
Figure 6. Early warning of a nearby flash without prior lightning activity on 13 November 2015. The top plot shows distance to the lightning flash with time. Horizontal lines on this plot represent US METAR lightning reporting thresholds: red for overhead and orange for vicinity. The middle plot shows the time of warnings produced by the BTD-300. The ‘warning flag’ number indicates the type of event which triggered them. In this instance, warnings were produced by charged rain (flag 2), sometimes combined with strong electric field variability (flag 4), approximately 3min before the first flash of the storm, which was nearby. The lower plot shows rain rate with time. Heavy and moderate rainfall is indicated by filled blue triangles and circles, respectively. Despite being charged, rainfall rates before this flash were only moderate, at 2–4mmh−1.
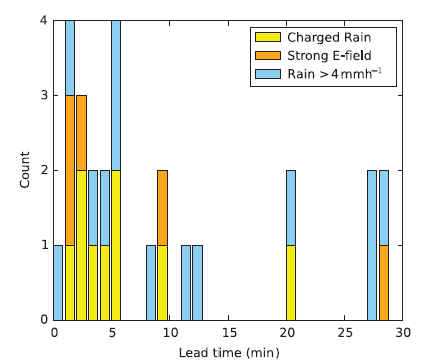
Figure 7. Lead times of charged rain (CR), strong E-field variability (dE) and rainfall >4mmh−1 (RA+4) to the first nearby flash of a thunderstorm. Data presented as a stacked histogram at 1min intervals, with the height of the bar indicating the number of incidences recorded.
Performance compared with electric field mills
An electric field mill is a device which directly measures the steady (usually <1Hz) electric field. These instruments are used as part of thunderstorm warning systems due to their ability to detect the strong electric field present below a cumulonimbus (e.g. Bennett and Harrison, 2007). No electric field mill was available for direct comparison in this study, although their POD and FAR are reported in the scientific literature. For example, an investigation by Aranguren et al. (2009) determined FAR and POD of a field mill to warn of lightning within 10km, based on data from 7 Spanish thunderstorms. The study also used 30min as an upper limit of appropriate warning lead time. Using a threshold based warning, the FAR was around 90%, but POD ranged between 70% for the lowest electric field magnitude (~100Vm−1), to <10% for thresholds of 2300–3000Vm−1.
Using the 70 flashes within 10km available for the present study, the FAR and POD were found to be 87 and 36% respectively for CR, with 77 and 21% for dE. These POD equated to those reported by Aranguren et al. (2009) for electric field threshold values of 700–1100Vm−1 for CR and 1200–1600Vm−1 for dE. The FAR reported for the field mill threshold was the same for CR. The FAR for the field mill was higher than that for dE for the complete range of thresholds used, even up to their maximum at 3000Vm−1. Aranguren et al. (2009) also investigated a field polarity reversal based technique, which produced a lower FAR than using thresholds alone, being comparable with that for dE. Mean lead times of CR (12.1min) and dE (13.6min) were longer than the 6.5–8min reported by Aranguren et al. (2009) for the field mill. The performance of CR and dE in warning of lightning are therefore considered at least comparable, if not somewhat better in terms of FAR and lead time, to the more established warning methods, which use an electric field mill.
Discussion
The ability of rainfall and electrical parameters to provide up to 30min warning of nearby flashes was assessed. Distant lightning (19–83km range) was the most likely parameter to occur before a nearby lightning flash and had the highest threat score, so offers the greatest overall performance for early warning.
For the 44% of storms where the first flash occurred nearby, charged rain (CR) and strong electric field variability (dE) provided a vital early warning of these developing or low flash rate storms, albeit with only a few minutes lead time. Considering the low probability of detection for CR and dE, these parameters are not recommended to be used for thunderstorm warning without the addition of distant lightning information. However, due to the high success ratio of dE, when it does occur this warning should be considered more seriously than charged precipitation or even distant lightning as a precursor of nearby lightning, which is reflected in the ascension of warning severity used by the BTD-300. The probability that rainfall is significantly charged increases with intensity, although it was identified that rainfall charge has a greater skill in warning of imminent nearby lightning than intensity. It must therefore be concluded that no single parameter, including distant lightning detection, was sufficient to provide a satisfactory early warning of the first nearby lightning flash. Instead, a combination of lightning and in situ atmospheric electrical parameters was required to provide the greatest chance of early warning, with 33 successes out of 43 nearby storms (77%). If early warning of only overhead lightning (<9.3km) is considered, the combination was successful in 10 out of 11 thunderstorms (91%).
Appendix
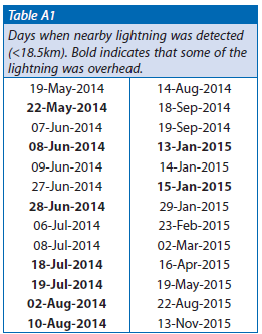
A list of days when nearby lightning (<18.5km) was detected is provided in Table A1. Those dates highlighted in bold indicate that some of the lightning was overhead. The 26 days with nearby lightning is significantly higher than the climatological expectation for this location of 8–10 days where thunder is heard per year, according to the Met Office 1971–2000 annual average. This can be explained by the reality that thunder from lightning 18.5km away is unlikely to be heard above ambient noise levels, especially when inside a building. A more likely upper limit of audible thunder is that for overhead lightning (within 9km), which was present on 9 of the 520 days, or approximately 6 days per year. Although the dataset is small compared with climatological statistics, such results suggest that a significant proportion of thunderstorms within the vicinity of a site pass by unnoticed to a human observer, especially during the daytime when the flash of lightning is harder to identify.
References
Aranguren D, Montanya J, Solá G et al. 2009. On the lightning hazard warning using electrostatic field: analysis of summer thunderstorms in Spain. J. Electrostat. 67(2): 507–512.
Bennett AJ. 2013. Identification and ranging of lightning flashes using co-located antennas of different geometry. Meas. Sci. Technol. 24: 125801.
Bennett AJ, Harrison RG. 2007. Atmospheric electricity in different weather conditions. Weather 62(10): 277–283.
Bennett AJ, Harrison RG. 2008. Variability in surface atmospheric electric field measurements. J. Phys.: Conf. Ser. 142(1): 012046.
Chalmers JA. 1961. The electricity of precipitation. Br. J. Appl. Phys. 12(8): 372.
Civil Aviation Authority. 2014. Requirements for Meteorological Observations at Aerodromes. CAP 746 Civil Aviation Authority, Gatwick, UK.
Darden CB, Nadler DJ, Carcione BC et al. 2010. Utilizing total lightning information to diagnose convective trends. Bull. Am. Meteorol. Soc. 91(2): 167–175.
Elsom DM, Webb JD. 2014. Deaths and injuries from lightning in the UK, 1988–2012. Weather 69(8): 221–226.
Federal Aviation Administration (FAA). 2011. Advisory circular: Automated Weather Observing Systems (AWOS) for non-federal applications. 150-5220-16D. US Department of Transportation, Washington, DC.
Grahame N, Page A, Hickman A et al. 2015. An unusual thunderstorm event overnight 13/14 June 2014. Weather 70(6): 167–172.
Meteorological Office. 1982. Observers Handbook, 4th edn, MO 933. Her Majesty’s Stationery Office: London.
Simpson GC. 1909. On the electricity of rain and its origin in thunderstorms. Phil. Trans. R. Soc. A 209: 379–413.
Simpson GC. 1949. Atmospheric electricity during disturbed weather. Geophys. Mem., London Meteorol. Off. 84: 1–51.
Wilson CTR. 1929. Some thundercloud problems. J. Franklin Inst. 208(1): 1–12.
World Meteorological Organization. 2008. Guide to Meteorological Instruments and Methods of Observation. WMO No. 8, 1.14-7. World Meteorological Organization: Geneva, Switzerland.
Published in the RMetS, Royal Meteorological Society, Weather – June 2018, Vol. 73, No.6